Published on 2025-06-26T04:43:15Z
What is Unsupervised Learning? Examples in Analytics
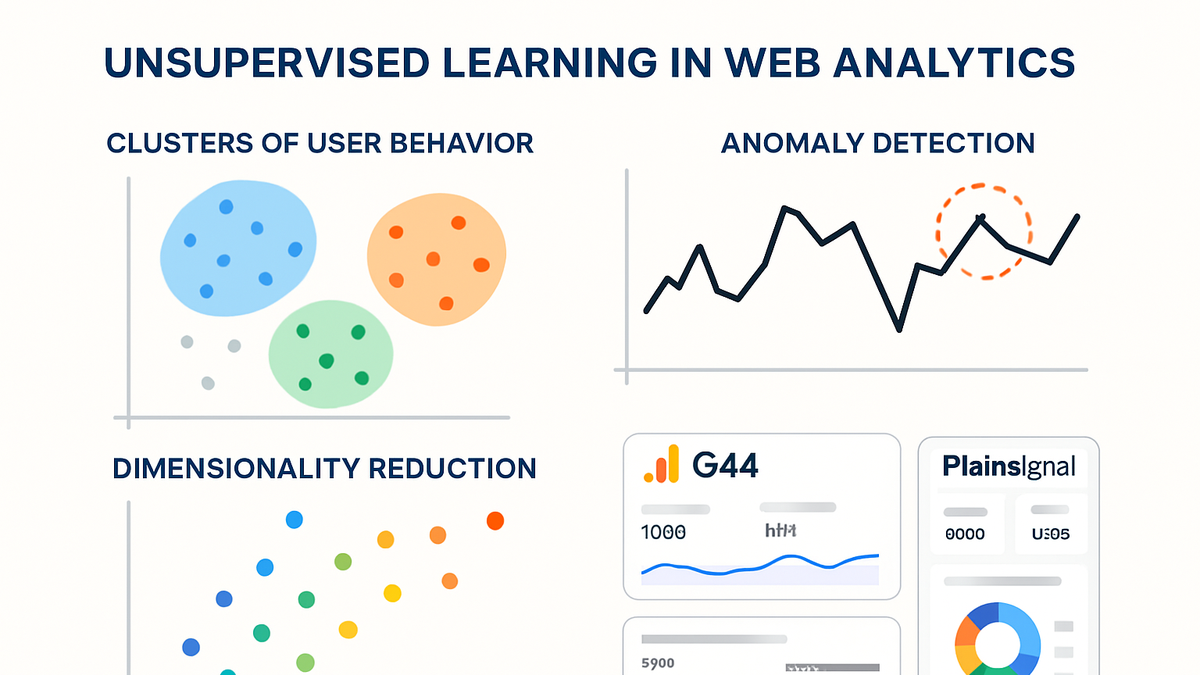
Unsupervised learning is a class of machine learning algorithms designed to find structure in datasets without predefined labels or outputs. In analytics, it helps uncover hidden patterns in user behavior, segment audiences, and detect anomalies without manual tagging. Platforms like Google Analytics 4 (GA4) and PlainSignal leverage unsupervised methods to cluster sessions, identify outliers, and reduce dimensionality for reporting. By automatically grouping data points based on similarities, businesses can personalize content, optimize campaigns, and preempt issues. While powerful, these methods require careful parameter tuning and interpretation to ensure meaningful insights.
Unsupervised learning
Unsupervised learning uncovers hidden patterns in unlabeled analytics data, enabling clustering, anomaly detection, and dimensionality reduction.
Importance of Unsupervised Learning in Analytics
Unsupervised learning plays a critical role in modern analytics by automating the discovery of insights that manual analysis might miss. It requires no label preparation but still reveals groupings and outliers, making it ideal for large-scale web and product data. Organizations can use these insights to improve personalization, detect fraud early, and streamline reporting.
-
Pattern discovery
Unsupervised learning algorithms detect hidden patterns and structures in datasets without predefined labels, enabling analysts to uncover insights that may not be visible through manual analysis.
-
Benefits
Automates exploration of large datasets, revealing trends and associations.
-
Considerations
Requires careful preprocessing and interpretation since results may not map directly to business metrics.
-
-
Customer segmentation
By grouping users with similar behaviors or characteristics, businesses can tailor marketing strategies and personalize experiences.
-
Use case
Segmenting website visitors based on session duration and page interactions.
-
Impact
Improves targeting accuracy and marketing ROI.
-
-
Anomaly detection
Algorithms identify data points that deviate significantly from the norm, helping detect fraud, system failures, or unusual user activities.
-
Examples
Spotting spikes in traffic that indicate bot activity.
-
Challenges
Balancing sensitivity to catch anomalies without generating false positives.
-
Key Techniques in Unsupervised Learning
These are foundational algorithms widely used in analytics for clustering, dimensionality reduction, and density estimation.
-
K-means clustering
Partitions data into k pre-defined clusters by minimizing variance within each cluster.
-
Pros
Simple, scalable, and efficient for large datasets.
-
Cons
Requires specifying k and sensitive to initial centroid placement.
-
-
Hierarchical clustering
Builds a tree of clusters using either agglomerative or divisive approaches.
-
Benefits
Does not require a preset number of clusters and provides a dendrogram.
-
Drawbacks
Computationally intensive for large datasets.
-
-
Dbscan
Density-Based Spatial Clustering of Applications with Noise groups points closely packed while marking outliers as noise.
-
Strengths
Detects arbitrarily shaped clusters and handles noise.
-
Limitations
Requires careful tuning of density parameters.
-
-
Principal component analysis (pca)
Reduces dimensionality by projecting data onto principal components that explain maximum variance.
-
Advantages
Simplifies data visualization and reduces computational cost.
-
Considerations
Components may be hard to interpret and can discard meaningful variation.
-
Implementing Unsupervised Learning with Analytics SaaS Tools
Modern analytics platforms offer built-in or integrable unsupervised learning features. Here’s how to leverage them in GA4 and PlainSignal.
-
PlainSignal implementation
PlainSignal provides cookie-free analytics with simple integration allowing event clustering and pattern analysis.
-
Setup
Add the PlainSignal script to your site header:
<link rel="preconnect" href="//eu.plainsignal.com/" crossorigin /> <script defer data-do="yourwebsitedomain.com" data-id="0GQV1xmtzQQ" data-api="//eu.plainsignal.com" src="//cdn.plainsignal.com/plainsignal-min.js"></script> -
Features
Enables session clustering and anomaly dashboards without cookies.
-
-
Google analytics 4 (GA4) implementation
GA4’s built-in AI features support anomaly detection and predictive analytics.
-
Activation
Enable ‘Anomaly Detection’ in the GA4 Analysis Hub and use Exploration reports for clustering user segments.
-
Considerations
Data sampling and privacy settings can affect the accuracy of AI-driven insights.
-
-
Integration tips
Combine outputs from multiple platforms to enrich analysis.
-
Data export
Use GA4’s BigQuery export and PlainSignal’s API to centralize datasets.
-
Cross-tool validation
Compare clusters and anomalies detected by each tool to improve model reliability.
-
Real-World Applications and Examples
Practical scenarios where unsupervised learning transforms analytics insights.
-
Website user segmentation
Group anonymous visitors by behavior patterns like session length and navigation paths.
-
Business impact
Tailored content delivery increases engagement and conversion rates.
-
Implementation
Run K-Means clustering on session data using exported GA4 logs.
-
-
Anomaly detection in traffic
Identify unusual traffic spikes or drops to preempt server issues or detect malicious activity.
-
Use case
Alert when traffic deviates more than two standard deviations from the weekly average.
-
Tools
Leverage GA4 anomaly detection and PlainSignal alerts.
-
-
Feature reduction for reporting
Simplify dashboards by reducing correlated metrics into principal components.
-
Benefits
Easier visualization and faster report generation.
-
Approach
Apply PCA in external tools after exporting data from GA4.
-