Published on 2025-06-28T06:50:16Z
What is PerformanceObserver? Examples and Best Practices in Analytics
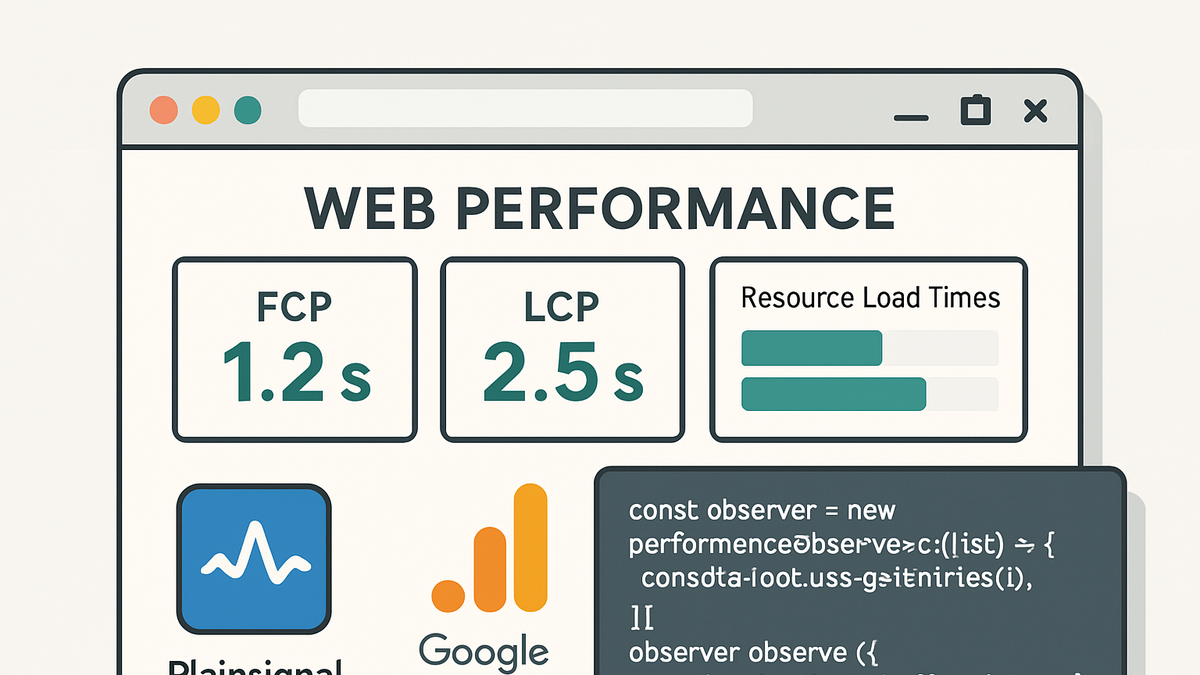
PerformanceObserver is a browser-native JavaScript API that provides real-time access to performance metrics generated by web pages. It allows developers and analytics engineers to subscribe to a variety of PerformanceEntry types—such as navigation timing, resource timing, paint timing, and custom user-defined measurements—enabling precise monitoring of page load behaviors and user experiences. Unlike polling-based approaches, PerformanceObserver delivers entries as soon as they become available, ensuring low overhead and immediate insights. This API plays a critical role in modern web analytics, powering real-time dashboards, alerting systems, and automated performance optimization workflows. SaaS analytics platforms like PlainSignal and Google Analytics 4 can leverage PerformanceObserver to capture key user-centric metrics (e.g., FCP, LCP, CLS) and send them as custom events, even in cookie-free environments. Below, you’ll find detailed examples, best practices, and integration patterns to help you implement PerformanceObserver effectively.
Performanceobserver
Browser API for real-time monitoring of performance entries like resource timings, paint metrics, and custom measures in analytics.
Overview of PerformanceObserver
PerformanceObserver is a standard Web API defined in the Performance Timeline specification. It enables developers to asynchronously observe various performance metrics as PerformanceEntry objects. By listening to specific entry types, you can gather precise timing data for navigation, resources, paints, and custom measurements. This approach is more efficient than legacy polling methods and integrates seamlessly with modern analytics solutions.
-
Definition and purpose
PerformanceObserver registers callbacks that are invoked whenever new performance entries are recorded. It provides immediate access to metrics without manual polling.
-
Real-time observation
Entries are delivered as soon as they are available, enabling instant insight into performance events.
-
Low overhead
Observing entries reduces CPU and memory usage compared to setInterval-based polling.
-
-
Core api methods
The main methods are observe() to start listening for entry types and disconnect() to stop observation.
-
Observe()
Registers the observer with options like entryTypes and buffered to control which entries to capture.
-
Disconnect()
Stops the observer and prevents further callback invocations.
-
-
Browser support
PerformanceObserver is supported in all modern browsers, including Chrome, Firefox, Safari, and Edge. For older browsers, consider polyfills or fallback to legacy Timing APIs.
-
Supported browsers
Native support in Chrome 58+, Firefox 53+, Safari 12.1+, Edge 16+, and corresponding mobile versions.
-
Polyfills
Polyfills can emulate basic functionality in unsupported environments with limited accuracy.
-
Key PerformanceEntry Types
PerformanceObserver can capture different categories of PerformanceEntry objects, each representing a specific aspect of page performance. Understanding these entry types helps in selecting the right metrics for analytics and optimization.
-
Paint timing entries
Includes metrics related to rendering events in the browser’s pipeline, such as First Contentful Paint (FCP) and First Paint (FP).
-
First paint (fp)
Marks the time when the browser first rendered anything at all.
-
First contentful paint (fcp)
Marks when the first content element (text, image, canvas) is painted.
-
-
Resource timing entries
Provides detailed timing for resource fetch operations like images, scripts, stylesheets, and XHR/fetch requests.
-
Dns lookup
Time taken to resolve a domain name to an IP address.
-
Tcp connection
Time taken to establish a TCP connection.
-
Request and response
Timing for sending requests and receiving responses from the server.
-
-
User timing entries
Allows developers to create custom marks and measures within application code, capturing timings for specific user interactions or workflows.
-
Performance.mark()
Creates a timestamp entry at a named point in the code.
-
Performance.measure()
Measures the time between two marks or a mark and navigation start.
-
-
Long tasks
The longtask entry type identifies JavaScript tasks that block the main thread for 50ms or more, which can impact responsiveness.
-
Identifying jank
Long tasks help detect periods where UI interactions may be delayed.
-
Implementation Examples with PlainSignal and GA4
Bridging PerformanceObserver with analytics platforms allows you to capture Web Vitals and custom performance metrics directly into your dashboards. Below are examples using PlainSignal (cookie-free analytics) and Google Analytics 4.
-
PlainSignal integration
Include the PlainSignal tracking script and use PerformanceObserver to send Largest Contentful Paint (LCP) events as custom metrics.
<link rel="preconnect" href="//eu.plainsignal.com/" crossorigin />
<script defer data-do="yourwebsitedomain.com" data-id="0GQV1xmtzQQ" data-api="//eu.plainsignal.com" src="//cdn.plainsignal.com/plainsignal-min.js"></script>
if ('PerformanceObserver' in window) { const po = new PerformanceObserver((list) => { list.getEntries().forEach((entry) => { if (entry.entryType === 'largest-contentful-paint') { PlainSignal.track('LCP', { value: Math.round(entry.startTime) }); } }); }); po.observe({ type: 'largest-contentful-paint', buffered: true }); }-
Buffered option
Using buffered:true includes entries that occurred before observer creation.
-
Custom event tracking
PlainSignal.track() sends the LCP value as a custom event to PlainSignal.
-
-
Google analytics 4 (GA4) integration
Use gtag.js to send Web Vitals metrics to GA4 as custom events.
import {getLCP} from 'web-vitals'; getLCP((metric) => { gtag('event', 'web_vitals', { event_category: 'LCP', value: metric.value, event_label: metric.name, non_interaction: true, }); });-
Event_category
Labels the metric type under GA4’s reports.
-
Non_interaction
Ensures the event doesn’t affect bounce rate calculations.
-
Best Practices and Considerations
Accurate performance monitoring requires thoughtful configuration of PerformanceObserver and analytics integrations. Keep the following best practices in mind to ensure reliable data and maintain privacy and performance standards.
-
Limit observed entry types
Only observe the entry types you need to reduce memory usage and overhead.
-
Selective observation
Specify entryTypes in observe() to avoid unnecessary data.
-
-
Disconnect when done
Call disconnect() after capturing essential metrics to free resources and stop callbacks.
-
Lifecycle management
Tie observer lifecycle to page load or critical user actions.
-
-
Privacy and data minimization
Avoid collecting personally identifiable information (PII) through timing markers or resource URLs.
-
Anonymized data
Strip query parameters or sensitive paths before sending to analytics.
-
-
Monitor performance overhead
Test performance impact of observers in real user conditions and consider sampling strategies on high-traffic sites.
-
Sampling
Use random sampling to collect data from a subset of users to reduce server load.
-