Published on 2025-06-27T20:52:42Z
What is a Performance Report? Examples in Analytics
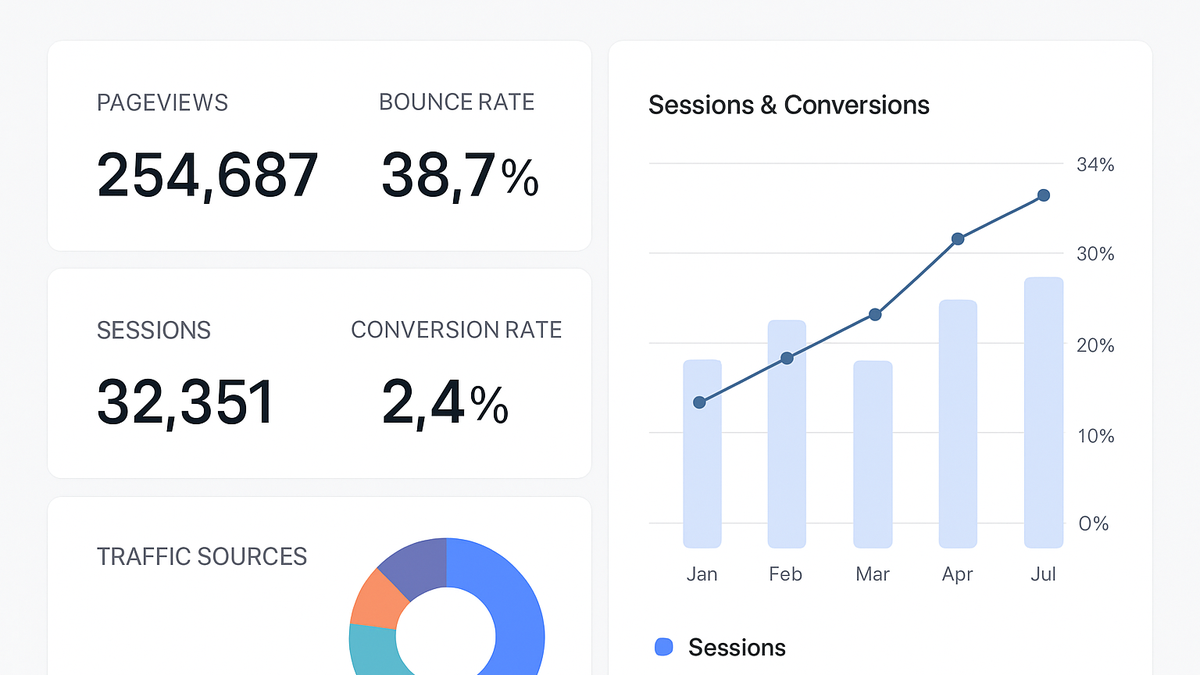
A Performance Report in analytics is a comprehensive document that summarizes key metrics and insights about a website’s or application’s performance. It helps organizations track user engagement, measure the effectiveness of marketing campaigns, and identify areas for optimization.
Performance reports typically include metrics such as pageviews, sessions, bounce rate, and conversion rate, presented in tables, charts, and graphs for easy interpretation. They can be generated using analytics platforms like PlainSignal (a cookie-free, privacy-friendly solution) and Google Analytics 4 (GA4).
Below is an example of how to integrate PlainSignal’s tracking snippet into your website:
<link rel="preconnect" href="//eu.plainsignal.com/" crossorigin />
<script defer data-do="yourwebsitedomain.com" data-id="0GQV1xmtzQQ" data-api="//eu.plainsignal.com" src="//cdn.plainsignal.com/plainsignal-min.js"></script>
Performance report
A Performance Report compiles key analytics metrics like pageviews and conversion rates to guide data-driven decision-making.
Purpose of Performance Reports
Performance reports are essential for translating raw data into actionable insights. They inform strategic decisions, enable optimization, and align teams on performance goals.
-
Decision support
Provides stakeholders with data-driven insights to guide marketing strategies, product development, and resource allocation.
-
Optimization
Highlights strengths and weaknesses in site performance, enabling continuous improvement of user experience and marketing ROI.
Core Metrics in Performance Reports
Performance reports revolve around a set of key metrics that quantify user behavior and engagement.
-
Pageviews
The total number of times pages on your site are loaded by users.
-
Formula
Sum of all page load events.
-
Why it matters
Shows which content resonates most with your audience.
-
-
Sessions
The number of discrete visits users make to your site within a specified time frame.
-
Formula
Counts unique session start events.
-
Why it matters
Measures overall site engagement and traffic volume.
-
-
Bounce rate
The percentage of sessions where users viewed only one page before leaving.
-
Formula
(Single-page sessions ÷ Total sessions) × 100.
-
Why it matters
Indicates potential issues with content relevance or user experience.
-
-
Conversion rate
The percentage of sessions that resulted in a predefined goal completion, such as sign-ups or purchases.
-
Formula
(Number of conversions ÷ Total sessions) × 100.
-
Why it matters
Assesses the effectiveness of your calls-to-action and funnel.
-
Generating Performance Reports
Learn how to set up and generate performance reports using popular analytics platforms.
-
Using PlainSignal
PlainSignal is a lightweight, cookie-free analytics tool that emphasizes simplicity and privacy. Integrate it by adding the following snippet to your site’s
<head>:<link rel="preconnect" href="//eu.plainsignal.com/" crossorigin /> <script defer data-do="yourwebsitedomain.com" data-id="0GQV1xmtzQQ" data-api="//eu.plainsignal.com" src="//cdn.plainsignal.com/plainsignal-min.js"></script>-
Integration steps
Place the code snippet before the closing
</head>tag on every page you wish to track. -
Accessing reports
Log in to the PlainSignal dashboard to view real-time and historical performance data.
-
-
Using google analytics 4
GA4 is Google’s advanced analytics platform offering deep insights and event-based tracking. Set it up using gtag.js or Google Tag Manager.
-
Setup via gtag.js
Add the GA4 gtag.js snippet to your site’s
<head>section. -
Setup via google tag manager
Configure a GA4 Configuration tag in GTM and publish the container.
-
Interpreting Performance Reports
Effective interpretation of performance data helps uncover trends, identify issues, and recognize opportunities for growth.
-
Trend analysis
Examine metric trajectories over time to understand seasonality, growth spurts, or declines.
-
Year-over-year
Compare current metrics to the same period in the previous year to account for seasonality.
-
Week-over-week
Monitor short-term trends to quickly detect anomalies.
-
-
Segment analysis
Break down performance by dimensions like device, geography, or traffic source to uncover hidden patterns.
-
Device type
Compare desktop vs. mobile user behavior.
-
Traffic source
Assess which marketing channels drive the most engaged traffic.
-
-
Benchmarking
Compare your metrics against industry standards or competitor data to gauge relative performance.
Best Practices
Adopt these best practices to ensure your performance reports are accurate, actionable, and aligned with business objectives.
-
Regular review
Set a consistent cadence (daily, weekly, monthly) for report analysis to stay proactive.
-
Align with business goals
Customize report metrics and targets to reflect your organization’s strategic objectives.
-
Automate reporting
Use scheduled exports, alerts, or APIs to automatically distribute insights to stakeholders.
-
Email alerts
Configure threshold-based notifications for significant metric changes.
-
Scheduled exports
Set up automated CSV or PDF report exports on a regular schedule.
-